Overview
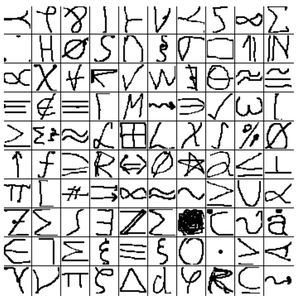
In this project, we aim to recognize various handwritten mathematical and alphabetical symbols using an image of the symbol.
For this purpose, we are using a Supervised Learning technique known as a deep Convolutional Neural Network.
Objective of this project was to familiarize myself with the use of frameworks like PyTorch for implementation of theoretical knowledge of Machine Learning techniques.
For this purpose, we are using a Supervised Learning technique known as a deep Convolutional Neural Network.
Objective of this project was to familiarize myself with the use of frameworks like PyTorch for implementation of theoretical knowledge of Machine Learning techniques.
Dataset Used
|
|
Model Architecture
Input image size is 32 x 32 and is in RGB format. We converted to grayscale before feeding to the network.
Consider a module consisting of a convolutional layer with filters of size 3 x 3 x 1 with stride 1, followed by a 2 x 2 max-pooling layer with stride 2, followed by ReLU activation function.
Models :
Other details :
Consider a module consisting of a convolutional layer with filters of size 3 x 3 x 1 with stride 1, followed by a 2 x 2 max-pooling layer with stride 2, followed by ReLU activation function.
Models :
- Model consisted of 3 of the mentioned modules stacked, each having no. of filters 10, 20, and 30 respectively, followed by 2 fully connected layers each having 1024, 512 hidden units and a softmax output layer at the end.
- Model consisted of 3 of the mentioned modules stacked, each having no. of filters 10, 20 and 40 respectively, followed by a softmax output layer at the end.
- Model consisted of 3 of the mentioned modules stacked, each having no. of filters 10, 20 and 40 respectively, followed by a softmax output layer at the end.
- Model consisted of 6 of the mentioned modules stacked, each having no. of filters 10, 30, 60, 100, 60, and 40 respectively, followed by a softmax output layer at the end.
Other details :
- Learning rate = 1e-3 and use of Xavier initialization.
- Learning rate = 1e-4, use of Xavier initialization, weight decay = 1e-3, regularization (lambda = 1e-6), dataset normalization with mean = 0.5 and standard deviation = 0.5, dropout applied at the last convolutional layer and in the softmax layer.
- Learning rate = 1e-4, use of Xavier initialization, weight decay = 1e-3, regularization (lambda = 1e-6), dataset normalization with mean = 0.5 and standard deviation = 0.5, dropout applied to each of the convolutional layers and in the softmax layer.
- Learning rate = 1e-3, use of Xavier initialization, weight decay = 1e-3, regularization (lambda = 1e-6) and dataset normalization with mean = 0.5 and standard deviation = 0.5
Results and Analysis
|
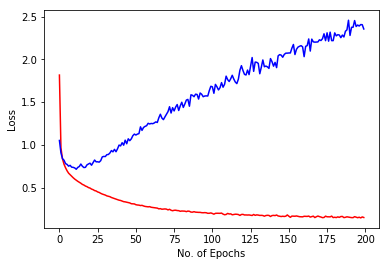
Model 1 :
Training Accuracy = 94.7104 % Test Accuracy = 74.2487 % Image shows training loss in red and validation loss in blue against no. of epochs for 200 epochs. Data overfit the model. So, we need to use regularization or data augmentation. So, we should use regularization (dropout or loss normalization) as data augmentation is difficult given the already large size. We can also explore other architectures. |
|
|
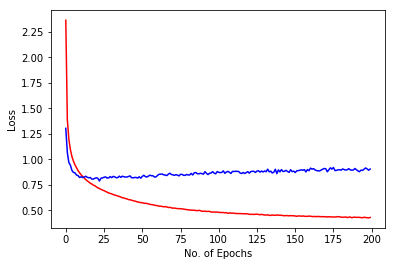
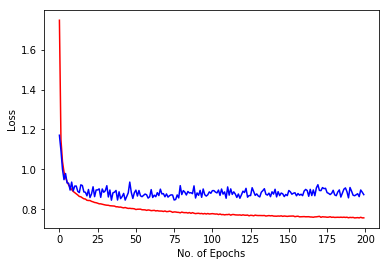
Model 2 :
Training Accuracy = 96.4304 % Test Accuracy = 76.7427 % Image shows training loss in red and validation loss in blue against no. of epochs for 200 epochs. Use of dropout helped to reduce overfitting. Training is still good due to decreased learning rate. But, overfitting is still there. |
|
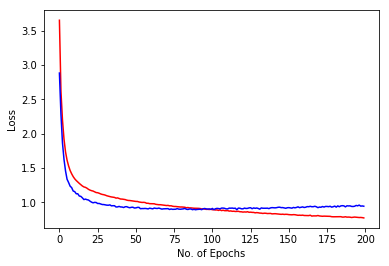
Model 3 :
Training Accuracy = 92.3716 % Test Accuracy = 75.0074 % Image shows training loss in red and validation loss in blue against no. of epochs for 200 epochs. Use of even more dropout helped to reduce overfitting to a greater extent than before. However, training is slower. |
|
|
Model 4 :
Training Accuracy = 82.0975 % Test Accuracy = 76.1117 % Image shows training loss in red and validation loss in blue against no. of epochs for 200 epochs. Overfitting was reduced but training became slower because of the regularization and weight decay being used. |
